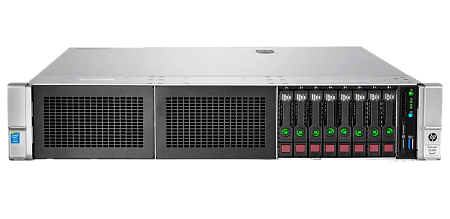
The right set of server infrastructure monitoring tools is the key to achieving the required VPS performance. Network monitoring allows you to prevent possible errors and failures in the early stages.
Instana, SolarWinds, Splunk Instana are very common network infrastructure monitoring tools. However, for all their advantages, they are not always optimal solutions. The main purpose of this article is to consider the most popular open source network monitoring systems.
Advantages of open source VDS monitoring tools
- Integrations. This advantage allows them to be easily integrated with other applications and tools. This simplifies tasks such as data storage and visualization.
- Expenses. Such tools are often installed and used for free.
- Data rights. Unlike many commercial tools, open source server monitoring programs allow users to maintain full ownership of service infrastructure data.
- No mandatory connection to software. Considered applications support working with any configuration.
Disadvantages of free VPS monitoring systems
- Complexity of deploying and managing open source monitoring platforms. This leads to increased maintenance costs.
- Limited functionality of some tools. It means that these tools cannot be considered as a universal option.
- Professional technical support. Obtaining this service may cause some difficulties. There is still a paid support option for many open source tools.
The best server monitoring systems
Zabbix
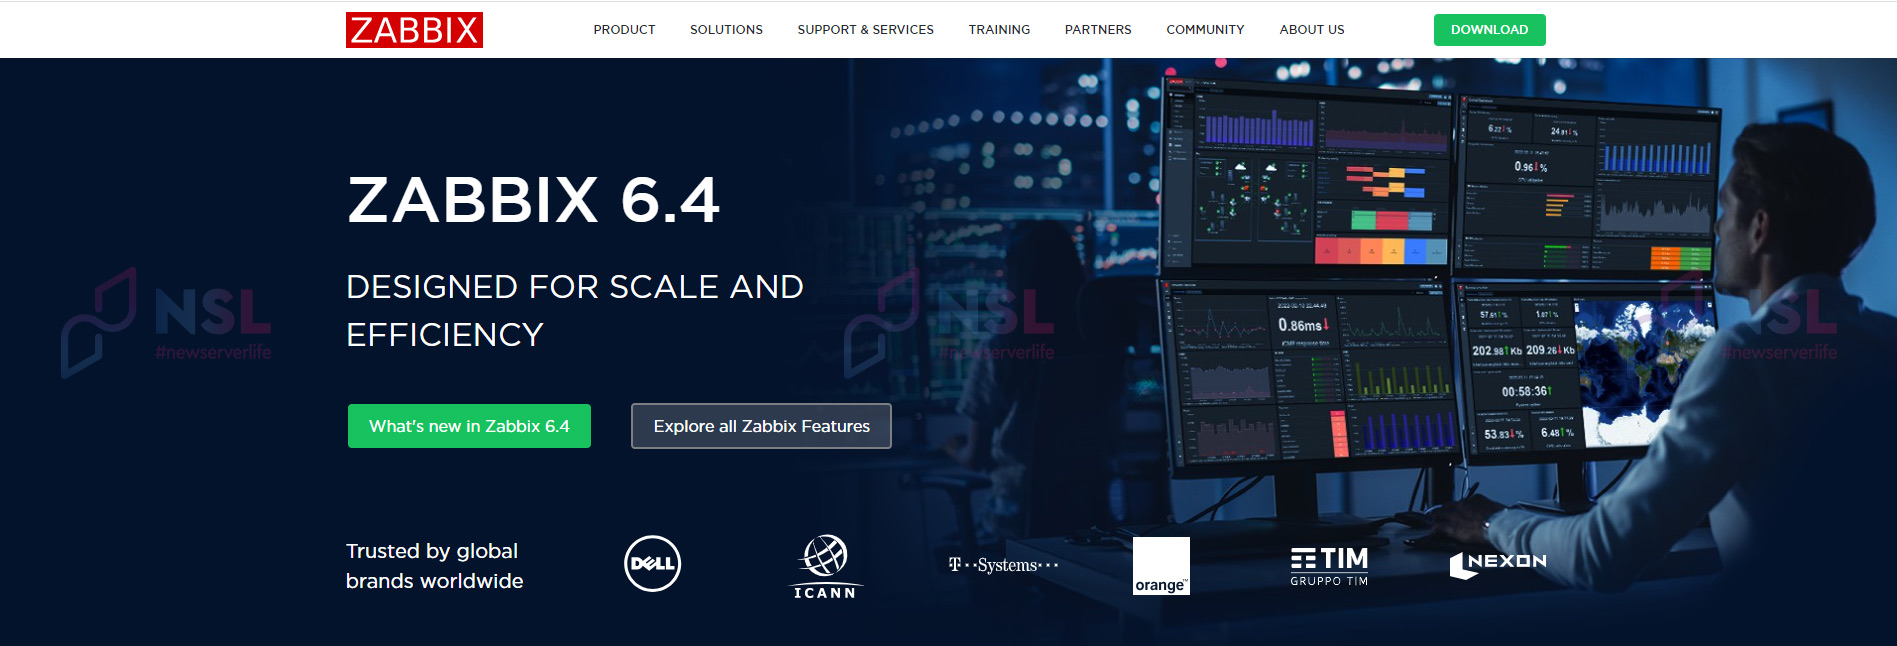
Zabbix is a very common system that is used by a large number of the biggest companies around the world. These include NVIDIA, Apple, DELL, IBM, Salesforce. Two main architectural elements (the Zabbix agent and the Zabbix server) formed the basis of Zabbix work. A Zabbix agent is installed on the server that needs to be monitored. all data that the Zabbix agent collects is transferred to the Zabbix server, which processes it and controls the situation in general. Agent installation is not required for services such as: DNS, FTP, HTTP and SSH.
Zabbix is compatible with the following operating systems:
- OpenBSD,
- Linux,
- FreeBSD,
- AIX,
- MacOS X,
- Windows,
- Solaris.
And SNMP support provides better reporting.
Zabbix advantages:
- Integration with other system management tools (bcfg2, Puppet, cfengine, Chef).
- Server performance check is available.
- Automation is available in different languages (Java, Perl, PHP, Ruby, Python) using basic or shell scripts.
- The Zabbix interface has automatic protection against brute force attacks.
- Java application servers are controlled via JMX.
- Provided support for vSphere, VMWare and vCenter environments.
You can learn more about the features and capabilities of Zabbix in this article on our blog.
Nagios

Core 4 is at the heart of Nagios operation and provides high levels of system performance by reducing the number of resources used.
Nagios has an ability to control a wide range of components:
- network protocols,
- services,
- websites,
- applications,
- operating systems,
- system metrics, etc.
Nagios is also widely used for middleware monitoring. These include JBoss, Tomcat, WebSphere, Apache, WebLogic, Nginx.
Comparing Zabbix and Nagios tools, it is worth noting that Nagios also has flexible configuration and convenient data collection. However, the advantage of Nagios is that it is available in:
- Nagios XI commercial version (extended range of features and improved applications),
- Nagios Core free version.
Nagios features:
- Extensible architecture.
- Centralized monitoring of the entire IT infrastructure.
- More than 1 million users.
- Failed applications are automatically restarted by handlers.
- Providing access with the ability to select viewing rights for individuals.
- A large number of additional plugins make it possible to integrate well with third-party services.
Prometheus + Grafana
The complex of these two open source tools is an all-in-one mechanism. Prometheus is used to collect metrics from the server, OS, applications, and Grafana is used to visualize them.
Using a large number of integrations, Prometheus has an ability to receive and process data from:
- storage,
- Windows,
- Linux,
- messaging systems,
- databases,
- routers,
- API.
As well as from specialized apps such as:
- JMX,
- Kubernetes,
- StatsD,
- Docker,
- HAProxy.
Prometheus advantages:
- Prometheus has a large number of client libraries. This makes it possible to easily instrument third-party applications.
- An ability to implement your own libraries.
- Support for more than ten languages.
- Implementation of a multidimensional information collection model. All data stored on this platform is presented in the form of time series. The necessary data can be easily found by metric name, timestamp, and set of key-value pairs.
- Simplification of management and increased reliability of operation is ensured by the emphasis of each Prometheus server on local storage only.
- Creation of special warnings, graphs and tables is provided by the PromQL query language module.
- Availability of several data visualization modes: console template language, embedded expression browser, Grafana integration.
Checkmk
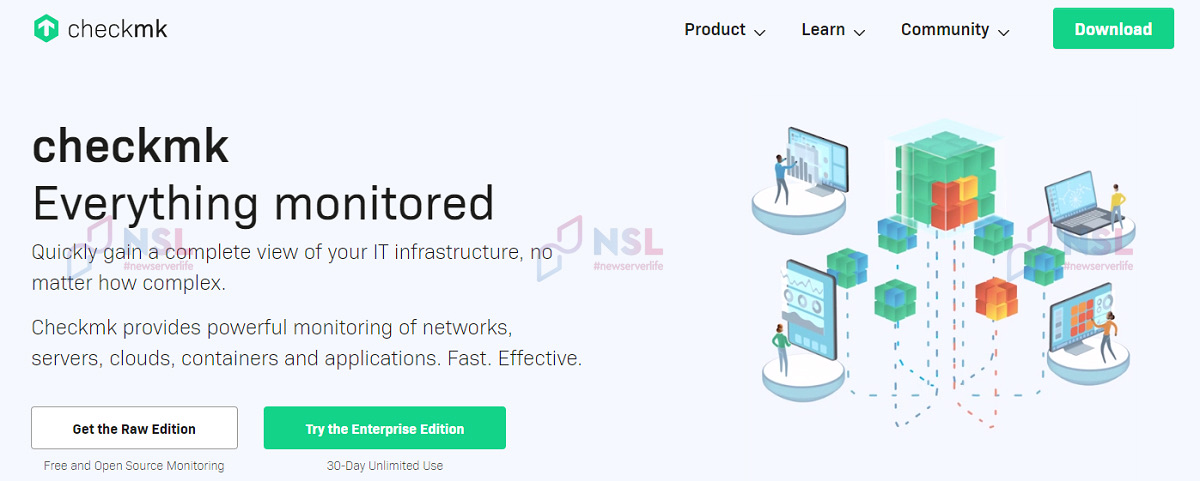
Checkmk is a highly scalable tool. It is used to monitor databases, servers, cloud resources, networks, IoT, etc. There are two versions of Checkmk:
- Commercial Enterprise Edition (including improved components and additional useful features).
- Free Raw Edition (fully open source).
Checkmk also supports tools and equipment from the most common vendors (Huawei, Cisco, Juniper, Fortinet, Checkpoint). Another important function is tracking servers, databases, cloud infrastructure (AWS, Asure), storage, as well as many applications and other elements of IT infrastructure.
Checkmk features:
- An ability to use this tool to monitor large environments using the distributed monitoring function.
- Fast deployment.
- Wide range of integration options with third-party software (including Azure, Docker, AWS, Kubernetes).
- Improved monitoring capabilities are achieved through a high level of automation.
- High level of automation also reduces manual setup time.
- Flexible monitoring (access to more than 1900 official integrations). Using API vendors, Checkmk agents, SNMP and other tools, Checkmk application monitors events, states, metrics and logs.
Cacti

Cacti is another reliable open source server infrastructure monitoring tool. It can be installed on Linux or Windows OS. Connecting this tool to RRDTool makes it possible to create graphs associated with the corresponding network data.
Cacti requires Apache, MySQL or IIS with PHP support for its operation. Interacting with SNMP, Cacti presents network statistics in the form of simple and understandable diagrams.
Cacti advantages:
- Custom data collection scripts.
- Support for automatic filling of charts.
- Custom security and control settings.
- Support for RRD files with the ability to select and operate an RRD file stored anywhere on the local file system.
- The ability to install an unlimited number of elements for each graph using CDEF or data sources from Cacti.
Icinga
Icinga – is a tool that has the function of monitoring all systems available on the network. If any failures or errors occur, Icinga uses various methods to alert you, including providing a database for SLA reporting.
Icinga was originally developed as a fork of Nagios, which allowed it to expand the range of functions of the original. After the release of the Icinga2 version, this tool became more convenient and faster to configure and scale.
Icinga features:
- Template-based reports.
- Monitoring the availability of network protocols and services, servers as well as host services.
- Providing a choice between two user interfaces – Icinga Web and Classic UI.
- Support for event handlers and notifications.
- Parallel service checks.
- Providing support in different ways (by phone call, message, email).
- Cross-platform support for various operating systems.
LibreNMS
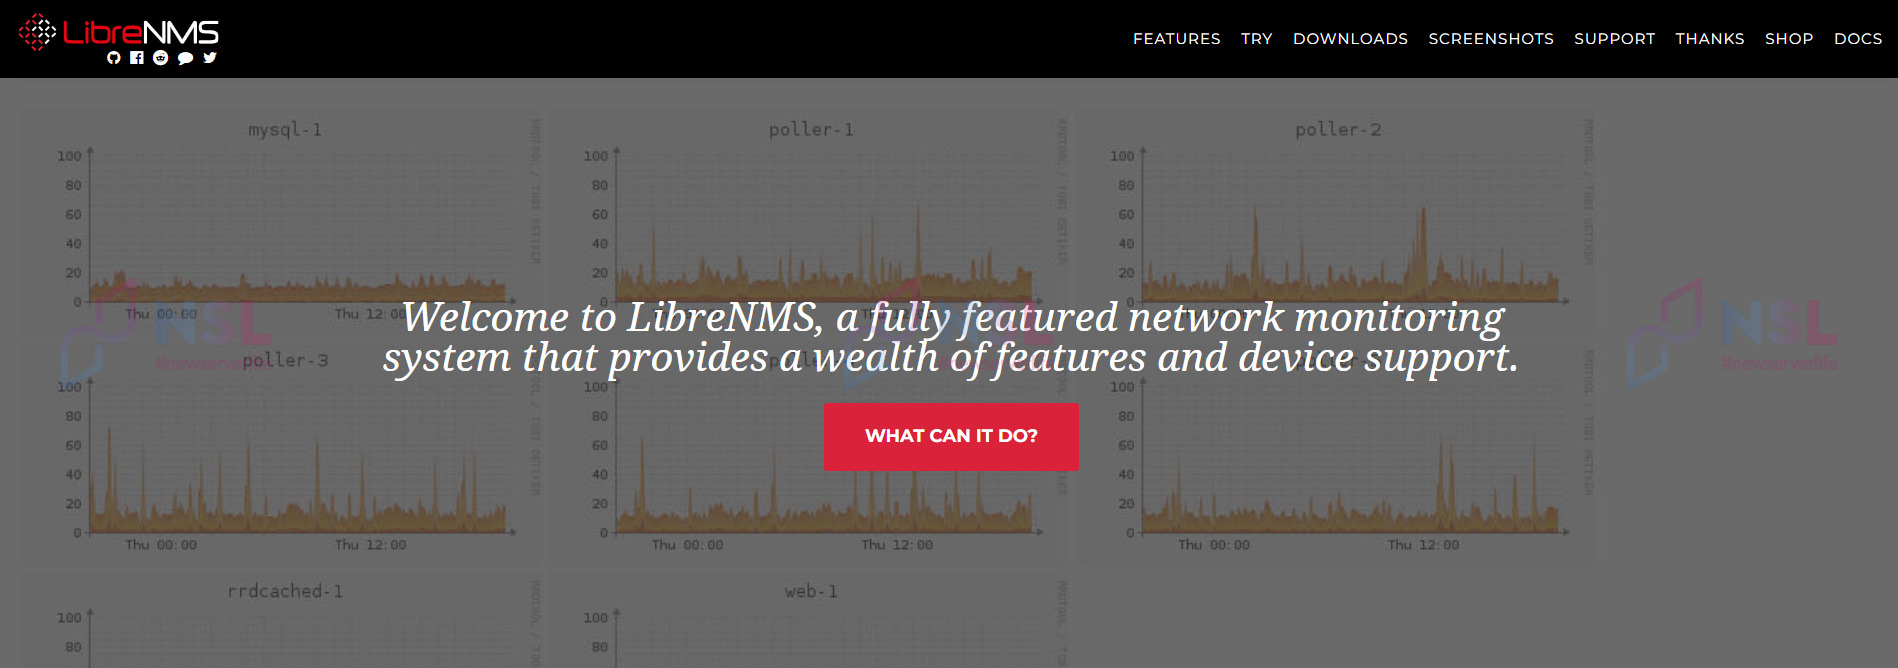
LibreNMS is a full-featured network equipment monitoring system based on PHP / MySQL / SNMP. This tool can be used for a large number of network equipment and operating systems such as:
- Juniper,
- Windows,
- Foundry,
- Linux,
- Cisco,
- Solaris,
- OSX.
Grouping of interfaces is performed based on the interface prefix. Using SNMP, ARP, CDP, FDP, LLDP, OSPF and BGP, the entire network can be covered by automatic discovery.
LibreNMS advantages:
- IPv4 and IPv6 support.
- Possibility of installation in Docker.
- Improved user interface.
- Customizable admin panel.
- Horizontal scaling.
- Availability of a map of geographic nodes reflecting any service failures or errors (using Google Maps, Open Street Map or Mapquest).
- Power supply monitoring and device temperature control.
- Customizable notifications and alerts via email, XMPP, Slack, SMS.
Conclusion
Using VDS is necessary for any server, since constant monitoring of its activity allows you to prevent possible problems and failures. Using VDS directly impacts the efficiency of the system as well as its optimal performance.
For those who run an online business, network server monitoring is especially important due to its ability to solve possible problems before they affect potential customers.
Reliable and powerful open source services considered in this article are the best choice for your business goals. These solutions offer many of the same benefits as commercial enterprise options without the huge cost. The owner of a virtual server just needs to choose a suitable free monitoring tool, taking into account the available technical resources and needs of the company.
Specialists of our company are ready to help you purchase the server and select the necessary server configuration for any required task.


